Chapter 1. Descriptive Statistics: Measures of Central Tendency
 Median
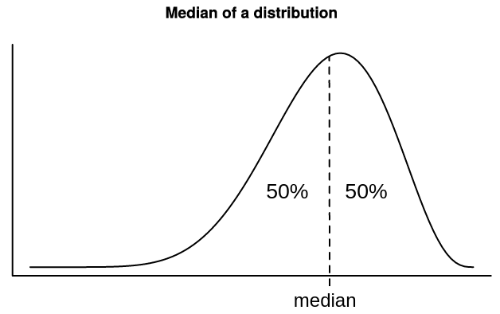
The median is the midpoint of a distribution. It is the score that divides the distribution into two equal halves.
The median is equivalent to the #50^{th}# percentile, meaning exactly #50\%# of the scores in a distribution are equal to or less than the median.

Median Calculation
To calculate the median, first order the scores in either ascending or descending order.
Next, determine whether there are an odd or even number of scores in the distribution.
- If the distribution consists of an odd number of scores, the median is the middle score in the list of ordered scores. This score will be located at the #(\cfrac{n+1}{2})#th position of the list.
- If the distribution consists of an even number of scores, the median is the value halfway between the middle two scores. These middle scores are located at the #(\cfrac{n}{2})#th and the #(\cfrac{n}{2} + 1)#th position of the list.
#\text{Median}=9.5#
There are a number of different ways we can calculate the median. Click on one of the panels to toggle a specific solution.
To determine the median of a sample, first order the scores in either ascending or descending order:
\[1,\,\,\,4,\,\,\,5,\,\,\,6,\,\,\,6,\,\,\,8,\,\,\,8,\,\,\,11,\,\,\,13,\,\,\,13,\,\,\,14,\,\,\,14,\,\,\,15,\,\,\,16\]
The sample is made up out of #n=14# scores.
Since there are an even number of scores in the sample, the median is equal to the average of the middle two scores of the ordered list.
These middle scores are located at the:
- #\cfrac{n}{2}=\cfrac{14}{2}=7#th and
- #\cfrac{n}{2}+1=\cfrac{14}{2}+1=8#th position
\[\text{Median} = \cfrac{X_{7}+X_{8}}{2} = \cfrac{8+11}{2} = 9.5\]
Assuming the sample scores are located in cells A1 through A14, the Excel command to calculate the median is:MEDIAN(array)
- array: The array or cell range of numeric values for which you want the median.
\[= \text{MEDIAN(A1:A14)}\]
This gives:
\[\text{Median} = 9.5\]
Thus, to calculate the median, run the following command:median(x)
- x: The numeric vector whose median you wish to calculate.
\[median(x = c(14,11,4,5,1,6,15,13,8,14,8,6,13,16))\]
Looking at the output generated by R, we find:
\[\text{Median}=9.5\]
#\phantom{0}#
Because the calculation of the median requires the data to be ordered, the median cannot be calculated for data which has been measured using a nominal scale.
\[
\begin{array}{c|cccc}
&\text{Nominal}&\text{Ordinal}&\text{Interval}&\text{Ratio}\\
\hline
\text{Mode}&\green{\text{Yes}}&\green{\text{Yes}}&\green{\text{Yes}}&\green{\text{Yes}}\\
\text{Median}&\red{\text{No}}&\green{\text{Yes}}&\green{\text{Yes}}&\green{\text{Yes}}\\
\end{array}
\]

Or visit omptest.org if jou are taking an OMPT exam.


