Chapter 1. Descriptive Statistics: Measures of Location II: z-Scores
 Z-scores
Earlier, percentiles and quartiles were introduced as a way to express the location of a score relative to all other scores within a distribution. This section will introduce another way to determine the location of a score within a distribution, but this time the location of the score is expressed relative to the mean of the distribution.
At first glance, deviation scores might be able to serve this purpose. One of the shortcomings of deviation scores, however, is that they do a relatively poor job of expressing the exact location of a score within a distribution. Although the sign of a deviation score indicates on which side of the mean the score is located, the value of a deviation score is not a good indication of how far from the mean the score is located. This is because the value of a deviation score is an absolute measure of the distance from the mean, which makes it heavily dependent on the magnitude of the scores that make up the distribution.
#\phantom{0}#
For example, a score that is located 5 units above the mean could either represent a large or a small distance from the mean, depending on the magnitude of the scores:
- If a distribution has a standard deviation of #\sigma=10#, then a deviation score of 5 would indicate that the score lies relatively close to the mean of the distribution.
- If a distribution has a standard deviation of #\sigma=2#, however, then a deviation score of 5 would indicate that the score lies somewhere near the edge of the distribution.
#\phantom{0}#
#\phantom{000}#
#\phantom{0}#
In order to transform a deviation score into a useful measure of location, standardize the deviation score by dividing it by the standard deviation of the distribution. The resulting measure is called a z-score.
#\phantom{0}#
Z-scores
Definition
A z-score or standard score is the standardized form of a deviation score.
Specifically, a z-score expresses a score's deviation from the mean in terms of standard deviation units.
Formula
\[z = \dfrac{X - \mu}{\sigma}\]
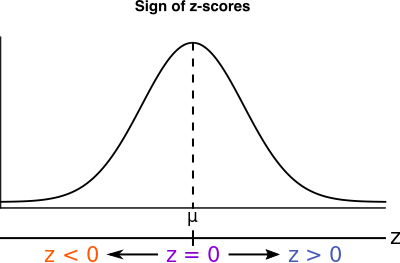
The sign of a z-score conveys the same information as the sign of a deviation score, namely on which side of the mean the score is located:
- Scores with a #\blue{\text{positive}}# z-score are located #\blue{\text{above}}# the mean.
- Scores with a #\orange{\text{negative}}# z-score are located #\orange{\text{below}}# the mean.
- A z-score of #\purple{\text{zero}}# means the score is #\purple{\text{equal}}# to the mean.
 #\phantom{0}#
Contrary to the value of a deviation score, the value of a z-score is a good indication of the exact location of a score because z-scores are independent of the measurement units used. This makes z-scores particularly well-suited for comparing scores that originate from different distributions. If two observations from two different distributions have the same z-score, this means that both scores are located at the same relative position within their respective distributions.
The formula for transforming sample scores into their corresponding z-scores is the following:
\[z=\dfrac{X-\bar{X}}{s}=\dfrac{90-80}{10}=1.00\]

Or visit omptest.org if jou are taking an OMPT exam.


