

[A, SfS] Chapter 6: Hypothesis Testing: 6.2: Test for Population Mean
 Hypothesis Test for a Population Mean
Hypothesis Test for a Population Mean
In this section, we will look at how to test whether the mean of a quantitative variable measured on a population differs from some benchmark value.
Suppose we have a continuous variable #X# whose mean value when measured on a specified population is denoted #\mu#.
Research Question and Hypotheses
The research question of a hypothesis test for a population mean is whether or not #\mu# differs from some benchmark value #\mu_0#.
Depending on the direction of the test, a hypothesis test for a population mean has one of the following pairs of hypotheses:
| Two-tailed | Left-tailed | Right-tailed |
|
|
|
Test Statistic and Null Distribution
Suppose a random sample of size #n# is selected from the population and #X# is measured on the sample, from which we obtain the sample mean #\bar{x}# and the sample standard deviation #s#.
As with confidence intervals, there are several conditions that guide the procedure we follow:
1) The distribution of #X# on the population is a normal distribution;
2) We know the value of the variance #\sigma^2# of #X# on the population;
3) The sample size #n# is large.
| Test statistic | Null distribution | Use when |
| \[Z=\cfrac{\bar{X} - \mu_0}{\sigma/\sqrt{n}}\] | \[N(0,1)\] |
|
| \[Z = \cfrac{\bar{X} - \mu_0}{s/\sqrt{n}}\] | \[N(0,1)\] |
|
| \[T = \cfrac{\bar{X} - \mu_0}{s/\sqrt{n}}\] | \[t_{n-1}\] |
|
Calculating the P-value
The calculation of the P-value of a hypothesis test for a population mean #\mu# depends on which form of #H_1# is being considered, and which test statistic is being used. We present the P-value calculations in the tables below, including the #\mathrm{R}# commands.
Test statistic: #Z \sim N(0,1)#; Computed value based on sample data: #z#.
#\begin{array}{lllll}
\phantom{0}\text{Direction}&\phantom{0000}H_0&\phantom{0000}H_1&\phantom{000}p\text{-value}&\phantom{0000000}\text{R Command}\\
\hline
\text{Two-tailed}&H_0:\mu = \mu_0&H_1:\mu \neq \mu_0&2\cdot \mathbb{P}(|Z|\geq |z|)&2 \text{ * }\text{pnorm}(\text{abs}(z),0,1, \text{low=FALSE})\\
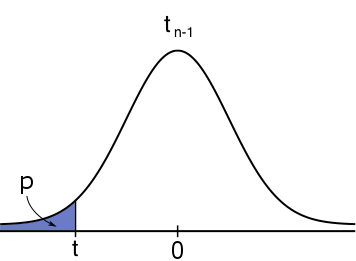
\text{Left-tailed}&H_0:\mu \geq \mu_0&H_1:\mu \lt \mu_0&\mathbb{P}(Z\leq z)&\text{pnorm}(z,0,1, \text{low=TRUE})\\
\text{Right-tailed}&H_0:\mu \leq \mu_0&H_1:\mu \gt \mu_0&\mathbb{P}(Z\geq z)&\text{pnorm}(z,0,1, \text{low=FALSE})\\
\end{array}#
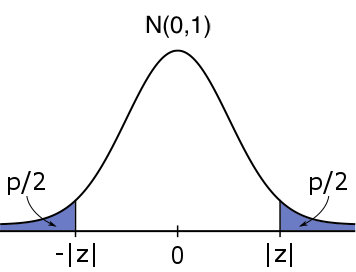 #H_1: \mu \neq \mu_0# #H_1: \mu \neq \mu_0# |
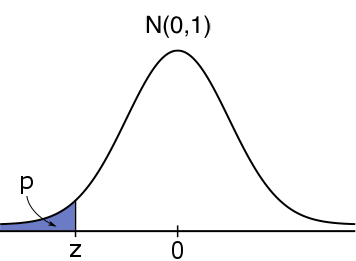 #H_1: \mu \lt \mu_0# #H_1: \mu \lt \mu_0# |
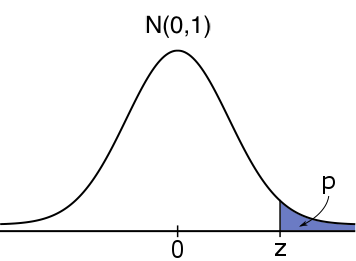 #H_1: \mu \gt \mu_0# #H_1: \mu \gt \mu_0# |
Test statistic: #T \sim t_{n-1}#; Computed value based on sample data: #t# with sample size #n#.
#\begin{array}{lllll}
\phantom{0}\text{Direction}&\phantom{0000}H_0&\phantom{0000}H_1&\phantom{000}p\text{-value}&\phantom{0000000}\text{R Command}\\
\hline
\text{Two-tailed}&H_0:\mu = \mu_0&H_1:\mu \neq \mu_0&2\cdot \mathbb{P}(|T|\geq |T|)&2 \text{ * }\text{pt}(\text{abs}(t),n\text{ - }1,\text{low=FALSE})\\
\text{Left-tailed}&H_0:\mu \geq \mu_0&H_1:\mu \lt \mu_0&\mathbb{P}(T\leq T)&\text{pt}(t,n\text{ - }1, \text{low=TRUE})\\
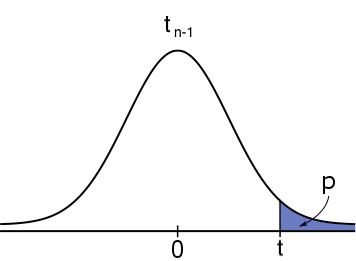
\text{Right-tailed}&H_0:\mu \leq \mu_0&H_1:\mu \gt \mu_0&\mathbb{P}(T\geq t)&\text{pt}(t,n\text{ - }1, \text{low=FALSE})\\
\end{array}#
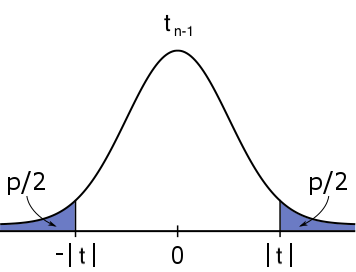 #H_1: \mu \neq \mu_0# #H_1: \mu \neq \mu_0# |
 #H_1: \mu \lt \mu_0# #H_1: \mu \lt \mu_0# |
 #H_1: \mu \gt \mu_0# #H_1: \mu \gt \mu_0# |
If the P-value is larger than the significance level #\alpha#, then the evidence against #H_0# is not convincing. Otherwise, we would reject #H_0# and conclude that there is sufficient evidence to support #H_1#.
Note that in #\mathrm{R}#, #\mathtt{abs(z)}# or #\mathtt{abs(t)}# compute the absolute value of the test statistic. You don’t need to use the #\mathtt{abs()}# command in practice, as long as you enter the absolute value of #z# or #t# yourself.
Suppose it is hypothesized that the mean pregnancy length for expectant mothers in a certain region is less than #270# days. Thus, we have the following hypotheses:
\[H_0: \mu \geq 270 \\
H_1: \mu < 270\]
Assume pregnancy lengths for expectant mothers in the region are normally distributed, and set #\alpha = 0.05#.
From a random sample of #n = 25# expectant mothers from the region, the sample mean pregnancy length is #\bar{x} = 264# and the sample variance is #s^2 = 150.80#.
The test statistic is: \[t = \cfrac{264 - 270}{\sqrt{150.80/25}} \approx -2.443\]
The sample size is small, so the corresponding P-value is found using the #t_{24}# distribution: \[P(T \leq -2.443) \approx 0.011\]
using the #\mathrm{R}# command:
pt(-2.443, 24, low = TRUE)
Since this P-value is less than #\alpha = 0.05#, we conclude in favor of #H_1#, i.e., that the mean pregnancy length for expectant mothers in that region is less than #270# days.
If instead, we had #n = 50# expectant mothers in the sample, then whether or not pregnancy lengths are normally-distributed in the region, we can use the normal distribution to compute the P-value, on the basis of the Central Limit Theorem.
Suppose the sample mean and sample variance are the same as above.
Then in this case: \[z = \cfrac{264 - 270}{\sqrt{150.80/50}} \approx -3.455\]
and the approximate P-value is: \[P(Z \leq -3.455) \approx 0.000275\]
using the #\mathrm{R}# command:
pnorm(-3.455, 0, 1, low = TRUE)
Since the P-value is less than #\alpha = 0.05#, we conclude in favor of #H_1#, i.e., that the mean pregnancy length for expectant mothers in that region is less than #270# days.


