Applications of differentiation: Analysis of functions
 Analysis of functions
In the previous paragraphs, we have seen how you can determine if a function increases or decreases on the basis of the derivative, that extremes always are a stationary point, in which 0 the derivative is 0.
With the help of these properties a function #f(x)# can be analyzed. You do this by following these seven steps.
- Determine all zeros of #f(x)#.
- Calculate the derivative function #f'(x)#.
- Determine the stationary points of #f(x)# (ie the zeros of #f'(x)#).
- Calculate the function value #f(x)# in each stationary point #x#.
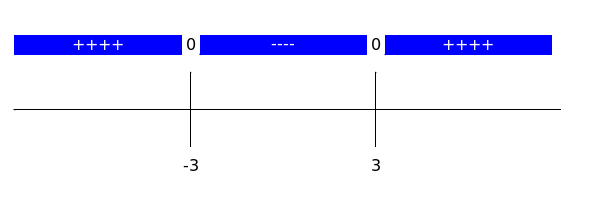
- Create a sign diagram of # f'(x)#. This is a diagram showing for values of #x# whether the function #f(x)# increases (which you would indicate with ++++) or decreases (which you would indicate with ----). The stationary points in the diagram are indicated with a 0, because in these the derivative equal to 0.
- Make an indication of the intervals where the function is increasing / decreasing.
- Make an accurate drawing of the graph of the function #f(x)#.
Analyse the function \[f(x)=x^3-27\cdot x\]
The zeros of #f(x)# are #x=0 \lor x=3^{{{3}\over{2}}} \lor x=-3^{{{3}\over{2}}}#.
The derivative is #f'(x)=##3\cdot x^2-27#.
The stationary points of #f(x)# are #x=-3 \lor x=3#.
The corresponding extreme values are #f\left(-3\right)=# #54# and #f\left(3\right)=# #-54#.
The sign diagram of #f'(x)# looks like this:

The increasing intervals of #f(x)# are #\ivoo{-\infty}{-3}# and #\ivoo{3}{\infty}#; the decreasing interval is #\ivoo{-3}{3}#.
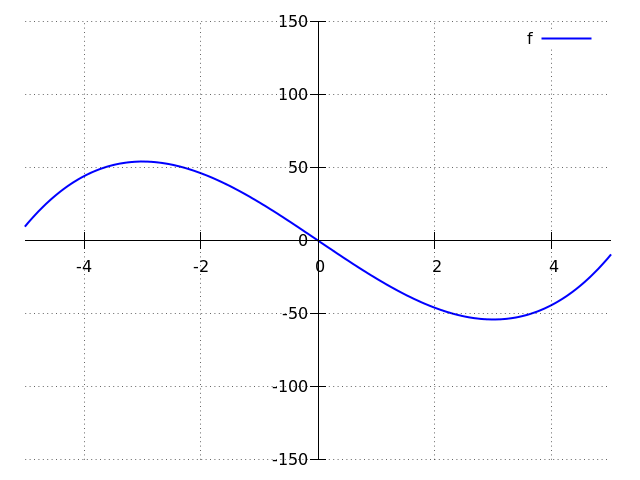
The graph of #f(x)# looks like this:

As for extreme points: at #x=-3# the function #f(x)# has a local maximum #54# and at #x=3# a local minimum #-54#. These local extrema are not global.
First, we calculate the zeros of #f(x)#:
\[\begin{array}{rcll}
f(x) =0&&&\phantom{xx}\color{blue}{\text{the equation we have to solve }} \\
x^3-27\cdot x =0&&&\phantom{xx}\color{blue}{\text{function rule entered }} \\
x \cdot \left(x^2-27\right) =0&&&\phantom{xx}\color{blue}{\text{left hand side factored}} \\
x=0 \lor x^2-27=0&&&\phantom{xx}\color{blue}{A\cdot B^2=0\Leftrightarrow A=0\lor B=0} \\
x=0 \lor x=3^{{{3}\over{2}}} \lor x=-3^{{{3}\over{2}}}&&&\phantom{xx}\color{blue}{A^2=a\Leftrightarrow A=\sqrt{a} \lor A=-\sqrt{a}} \\
\end{array}\]
Next, we calculate the derivative of #f(x)#. To this end we use the extended sum rule. It says that #f'(x)=\frac{\dd}{\dd x}\left(x^3\right)-27 \cdot\frac{\dd}{\dd x}\left (x\right)#.
With help of the polynomial rule for differentiation, which says that #\frac{\dd}{\dd x}\left(x^n\right)=n \cdot x^{n-1}# we now have:
\[\begin{array} {rcl} f'(x)&=&\frac{\dd}{\dd x}\left( x^3-27\cdot x\right)\\
&=&\frac{\dd}{\dd x}\left(x^3\right)-27 \cdot\frac{\dd}{\dd x}\left (x\right)\\
&&\phantom{xx}\color{blue}{\text{sum rule}}\\
&=&
3 \cdot x^{3-1} - 27 \cdot x^{1-1} \\
&&\phantom{xx}\color{blue}{\text{power rule}}\\
&=&3\cdot x^2-27 \end{array}\]
Now we calculate the stationary points of #f(x)#. Stationary points are the points for which we have #f'(x)=0#. Since #f'(x)=3\cdot x^2-27# we can find the stationary points the following way:
\[\begin{array}{rl}
3\cdot x^2-27=0&\phantom{xxx}\color{blue}{\text{equation entered}}\\
3\cdot x^2=27&\phantom{xxx}\color{blue}{-27 \text{ moved to the other side}}\\
x^2=9&\phantom{xxx}\color{blue}{\text{divided by 3}}\\
x=-3 \lor x=3&\phantom{xxx}\color{blue}{A^2=a\Leftrightarrow A=\sqrt{a} \lor A=-\sqrt{a}}\end{array}
\]
Next we find the corresponding values of #f(x)# with the stationary points. We find the value of #f# at #x=-3# by entering #x=-3# in #f(x)#:
\[f\left(-3\right)=\left(-3\right)^3-27 \cdot \left(-3\right)=54\tiny.\]
We determine the value of #f# at #x=3# in the same manner:
\[f\left(3\right)=\left(3\right)^3-27 \cdot \left(3\right)=-54\tiny.\]
Now we can make a sign diagram for #f(x)#. In the stationary points of #f#, we have #f'(x)=0#. Place the smallest stationary point on the left hand side, which is #-3# and the biggest one on the right, which is #3#.

If you take a look at the sign diagram of #f#, you see it has plus signs at the left up to #-3# and from #3# till the end. Hence, on the intervals #\ivoo{-\infty}{-3}# and #\ivoo{3}{\infty}#, the function #f# is increasing. On the part between #-3# and #3# the diagram has minuses, hence, on the interval #\ivoo{-3}{3}#, the function #f# is decreasing. This means that #\ivoo{-\infty}{-3}# and #\ivoo{3}{\infty}# are the increasing intervals of #f(x)#; the decreasing interval is #\ivoo{-3}{3}#.
With this information, the graph of #f(x)# can be drawn. It is shown near the top of this solution. In addition, you can now identify the extreme points: at #x=-3# the function #f(x)# has a local maximum #54# and at #x=3# a local minimum #-54#. These local extrema are not global.
The derivative is #f'(x)=##3\cdot x^2-27#.
The stationary points of #f(x)# are #x=-3 \lor x=3#.
The corresponding extreme values are #f\left(-3\right)=# #54# and #f\left(3\right)=# #-54#.
The sign diagram of #f'(x)# looks like this:

The increasing intervals of #f(x)# are #\ivoo{-\infty}{-3}# and #\ivoo{3}{\infty}#; the decreasing interval is #\ivoo{-3}{3}#.
The graph of #f(x)# looks like this:

As for extreme points: at #x=-3# the function #f(x)# has a local maximum #54# and at #x=3# a local minimum #-54#. These local extrema are not global.
First, we calculate the zeros of #f(x)#:
\[\begin{array}{rcll}
f(x) =0&&&\phantom{xx}\color{blue}{\text{the equation we have to solve }} \\
x^3-27\cdot x =0&&&\phantom{xx}\color{blue}{\text{function rule entered }} \\
x \cdot \left(x^2-27\right) =0&&&\phantom{xx}\color{blue}{\text{left hand side factored}} \\
x=0 \lor x^2-27=0&&&\phantom{xx}\color{blue}{A\cdot B^2=0\Leftrightarrow A=0\lor B=0} \\
x=0 \lor x=3^{{{3}\over{2}}} \lor x=-3^{{{3}\over{2}}}&&&\phantom{xx}\color{blue}{A^2=a\Leftrightarrow A=\sqrt{a} \lor A=-\sqrt{a}} \\
\end{array}\]
Next, we calculate the derivative of #f(x)#. To this end we use the extended sum rule. It says that #f'(x)=\frac{\dd}{\dd x}\left(x^3\right)-27 \cdot\frac{\dd}{\dd x}\left (x\right)#.
With help of the polynomial rule for differentiation, which says that #\frac{\dd}{\dd x}\left(x^n\right)=n \cdot x^{n-1}# we now have:
\[\begin{array} {rcl} f'(x)&=&\frac{\dd}{\dd x}\left( x^3-27\cdot x\right)\\
&=&\frac{\dd}{\dd x}\left(x^3\right)-27 \cdot\frac{\dd}{\dd x}\left (x\right)\\
&&\phantom{xx}\color{blue}{\text{sum rule}}\\
&=&
3 \cdot x^{3-1} - 27 \cdot x^{1-1} \\
&&\phantom{xx}\color{blue}{\text{power rule}}\\
&=&3\cdot x^2-27 \end{array}\]
Now we calculate the stationary points of #f(x)#. Stationary points are the points for which we have #f'(x)=0#. Since #f'(x)=3\cdot x^2-27# we can find the stationary points the following way:
\[\begin{array}{rl}
3\cdot x^2-27=0&\phantom{xxx}\color{blue}{\text{equation entered}}\\
3\cdot x^2=27&\phantom{xxx}\color{blue}{-27 \text{ moved to the other side}}\\
x^2=9&\phantom{xxx}\color{blue}{\text{divided by 3}}\\
x=-3 \lor x=3&\phantom{xxx}\color{blue}{A^2=a\Leftrightarrow A=\sqrt{a} \lor A=-\sqrt{a}}\end{array}
\]
Next we find the corresponding values of #f(x)# with the stationary points. We find the value of #f# at #x=-3# by entering #x=-3# in #f(x)#:
\[f\left(-3\right)=\left(-3\right)^3-27 \cdot \left(-3\right)=54\tiny.\]
We determine the value of #f# at #x=3# in the same manner:
\[f\left(3\right)=\left(3\right)^3-27 \cdot \left(3\right)=-54\tiny.\]
Now we can make a sign diagram for #f(x)#. In the stationary points of #f#, we have #f'(x)=0#. Place the smallest stationary point on the left hand side, which is #-3# and the biggest one on the right, which is #3#.
- Next you enter an #x \lt -3# in #f'(x)#. For example #x=-10#. Then you get #f'(-10)=3 \cdot (-10)^2 -27 =273#. Because #f'(x) \gt 0#, #f(x)# increases on the interval #x \lt -3# and you write down ++++.
- Next you enter a #-3 \lt x \lt 3# in #f'(x)#. For example #x=0#. Then you get #f'(0)=3 \cdot (0)^2 -27 =-27#. Because #f'(x) \lt 0#, #f(x)# decreases on the interval #-3 \lt x \lt 3# and you write down ----.
- Next you enter an #x \gt 3# in #f'(x)#. For example #x=10#. Then you get #f'(10)=3 \cdot (10)^2 - 27 =273#. Because #f'(x) \gt 0#, #f(x)# increases on the interval #x \gt 3# and you write down ++++.

If you take a look at the sign diagram of #f#, you see it has plus signs at the left up to #-3# and from #3# till the end. Hence, on the intervals #\ivoo{-\infty}{-3}# and #\ivoo{3}{\infty}#, the function #f# is increasing. On the part between #-3# and #3# the diagram has minuses, hence, on the interval #\ivoo{-3}{3}#, the function #f# is decreasing. This means that #\ivoo{-\infty}{-3}# and #\ivoo{3}{\infty}# are the increasing intervals of #f(x)#; the decreasing interval is #\ivoo{-3}{3}#.
With this information, the graph of #f(x)# can be drawn. It is shown near the top of this solution. In addition, you can now identify the extreme points: at #x=-3# the function #f(x)# has a local maximum #54# and at #x=3# a local minimum #-54#. These local extrema are not global.
Unlock full access


Teacher access
Request a demo account. We will help you get started with our digital learning environment.
Student access
Is your university not a partner?
Get access to our courses via Pass Your Math independent of your university. See pricing and more.
Or visit omptest.org if jou are taking an OMPT exam.
Or visit omptest.org if jou are taking an OMPT exam.


