Quadratic equations: Drawing parabolas
 Transformations of parabolas
We have seen how to draw the parabola for a quadratic. Now we will learn how to transform the quadratic #y=x^2# and next easily draw the parabola of the new formula.
Transformations
We can transform the formula #y=x^2# in three different ways.
| Transformations | Examples | |
| 1 |
We shift the graph of #y=x^2# up by #\green q#. The new formula is \[y=x^2+\green q\] |
geogebra plaatje
|
| 2 |
We shift the graph of #y=\blue{x}^2# to the right by #\blue p#. The new formula is \[y=\left(x-\blue p\right)^2\] |
geogebra plaatje
|
| 3 |
We multiply the graph of #y=x^2# with #\purple a# relative to the #x#-axis. The new formula is \[y=\purple a x^2\] |
geogebra plaatje
|
Vertex In Vertex of a parabola we saw that the vertex of a parabola of the form #y=a\left(x-\blue p\right)^2+\green q# is equal to #\rv{\blue p, \green q}#. By means of transformations, we will show why that is the case.
The formula #y=a\left(x-\blue p\right)^2+\green q# results from #y=x^2# by shifting the formula to the right by #\blue p# and shifting it up by #\green q#. The vertex of #y=x^2# is equal to #\rv{0,0}#. Now, the vertex of #y=a\left(x-\blue p\right)^2+\green q# relative to #\rv{0,0}# has shifted by #\blue p# to the right and up by #\green q#. Hence, the vertex is #\rv{\blue p, \green q}#.
Example
The formula #y=\left(x-\blue2\right)^2+\green5# results from the formula #y=x^2# by shifting it to the right by #\blue2# and #\green5# up. Hence, the vertex is #\rv{\blue2, \green5}#.
![]()
Multiplication with a negative numberIf we multiply relative to the #x#-axis by a negative number the parabola is reversed. A parabola opening downwards becomes a parabola opening upwards.
Example
If we multiply the formula #y=x^2# by #-1# the parabola is reflected across the #x#-axis. The new formula is #y=-x^2#.
![]()
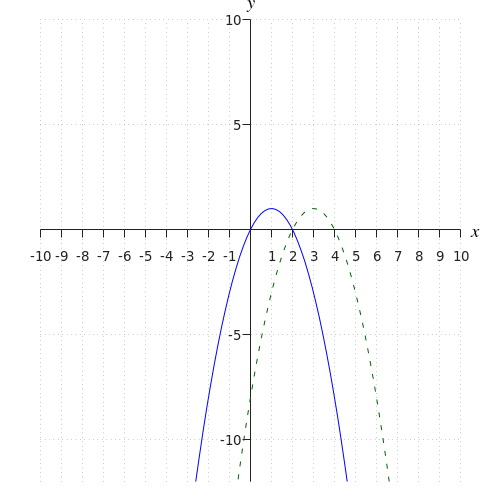
When we compare the formulas, we see that the new formula is obtained by adding #2# to the given formula. Therefore, the shape of the graph is the same as of the old formula, and the new graph is given by shifting the old one up #2#.
The intersection with the #y#-axis of the old graph is #\rv{0,-8}#. Because the function #2# shifts upward, the coordinates of the intersection with the #y#-axis of the new formula are equal to: #\rv{0,2}#.
The vertex of the given formula is equal to #\rv{1,1}#. Because the new graph shifts up by #2#, the coordinates of the vertex of the new graph are equal to: #\rv{1,3}# .
The old graph intersects the #x#-axis at the point with the #x# value #2#. In the new dashed graph, this point is moved #2# units. Therefore, the coordinates of the new point are: #\rv{2,2}#.

Or visit omptest.org if jou are taking an OMPT exam.