Functions: Fractional functions
 Asymptotes and hyperbolas
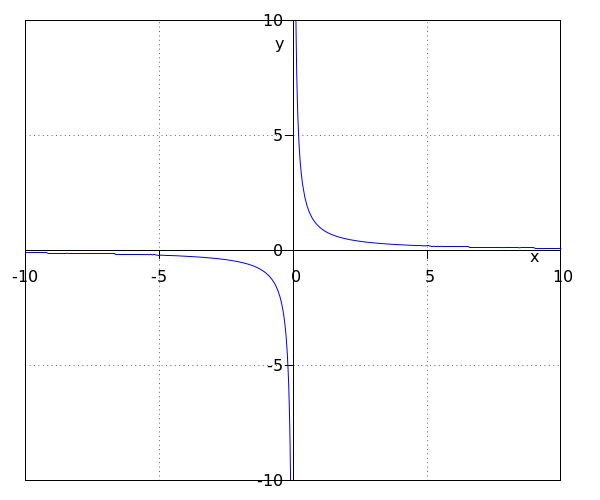
Take a look at the function #f(x)=\tfrac{1}{x}#. In the graph, we see that the function consists of two branches. This is because #0# is not part of the domain of the function and hence, #f(0)# does not exist. We name a graph consisting of two branches a #\blue{\textbf{hyperbola}}#.
We see that, if #x# becomes really negative or if #x# becomes really positive, the graph approaches the #x#-axis really closely. However, the function value never becomes equal to #0#. We call the #x#-axis, the line #y=0#, the #\purple{\textbf{horizontal asymptote}}# of the graph.
We also see that if the #x#-value approaches #0# from the negative side, the function value becomes arbitrarily negative: it decreases without any bound. On the other hand, if the #x#-value approaches #0# from the positive side, #f(x)# becomes arbitrarily positive. We call the #y#-axis, the line #x=0#, the #\green{\textbf{vertical asymptote}}# of the graph.

Asymptote and hyperbola
An asymptote is a line that the function approaches closer and closer to, but with which the graph never touches or coincides.
A hyperbola is a function which has a graph consisting of two separate parts because of its asymptotes. These two separate parts are also called the branches of the graph.
The horizontal asymptote is: #y=0#
After all, the vertical asymptote can be found by investigating which values for #x# cannot be entered in the function. In a fractional function, the denominator cannot be equal to #0#. The vertical asymptote is therefore equal to #x=-8#.
The horizontal asymptote can be found by entering very high values for #x# and investigating what happens with the function. If we enter very high values of #x#, then #x+8# becomes very big. Next #{{1}\over{x+8}}# approaches closer and closer to #0#, but never becomes equal to #0#. The horizontal asymptote is therefore equal to #y=0#.

Or visit omptest.org if jou are taking an OMPT exam.


